Overview
AppColl's Invention Manager (IM) product has an Inventions Home page which provides a dashboard for viewing a summary of your inventions information. This page is accessed by clicking on the Inventions module button or selecting Inventions Home from the menu.
If you do not see this menu item, the Inventions Home page will need to be enabled in your account. Please contact AppColl support.
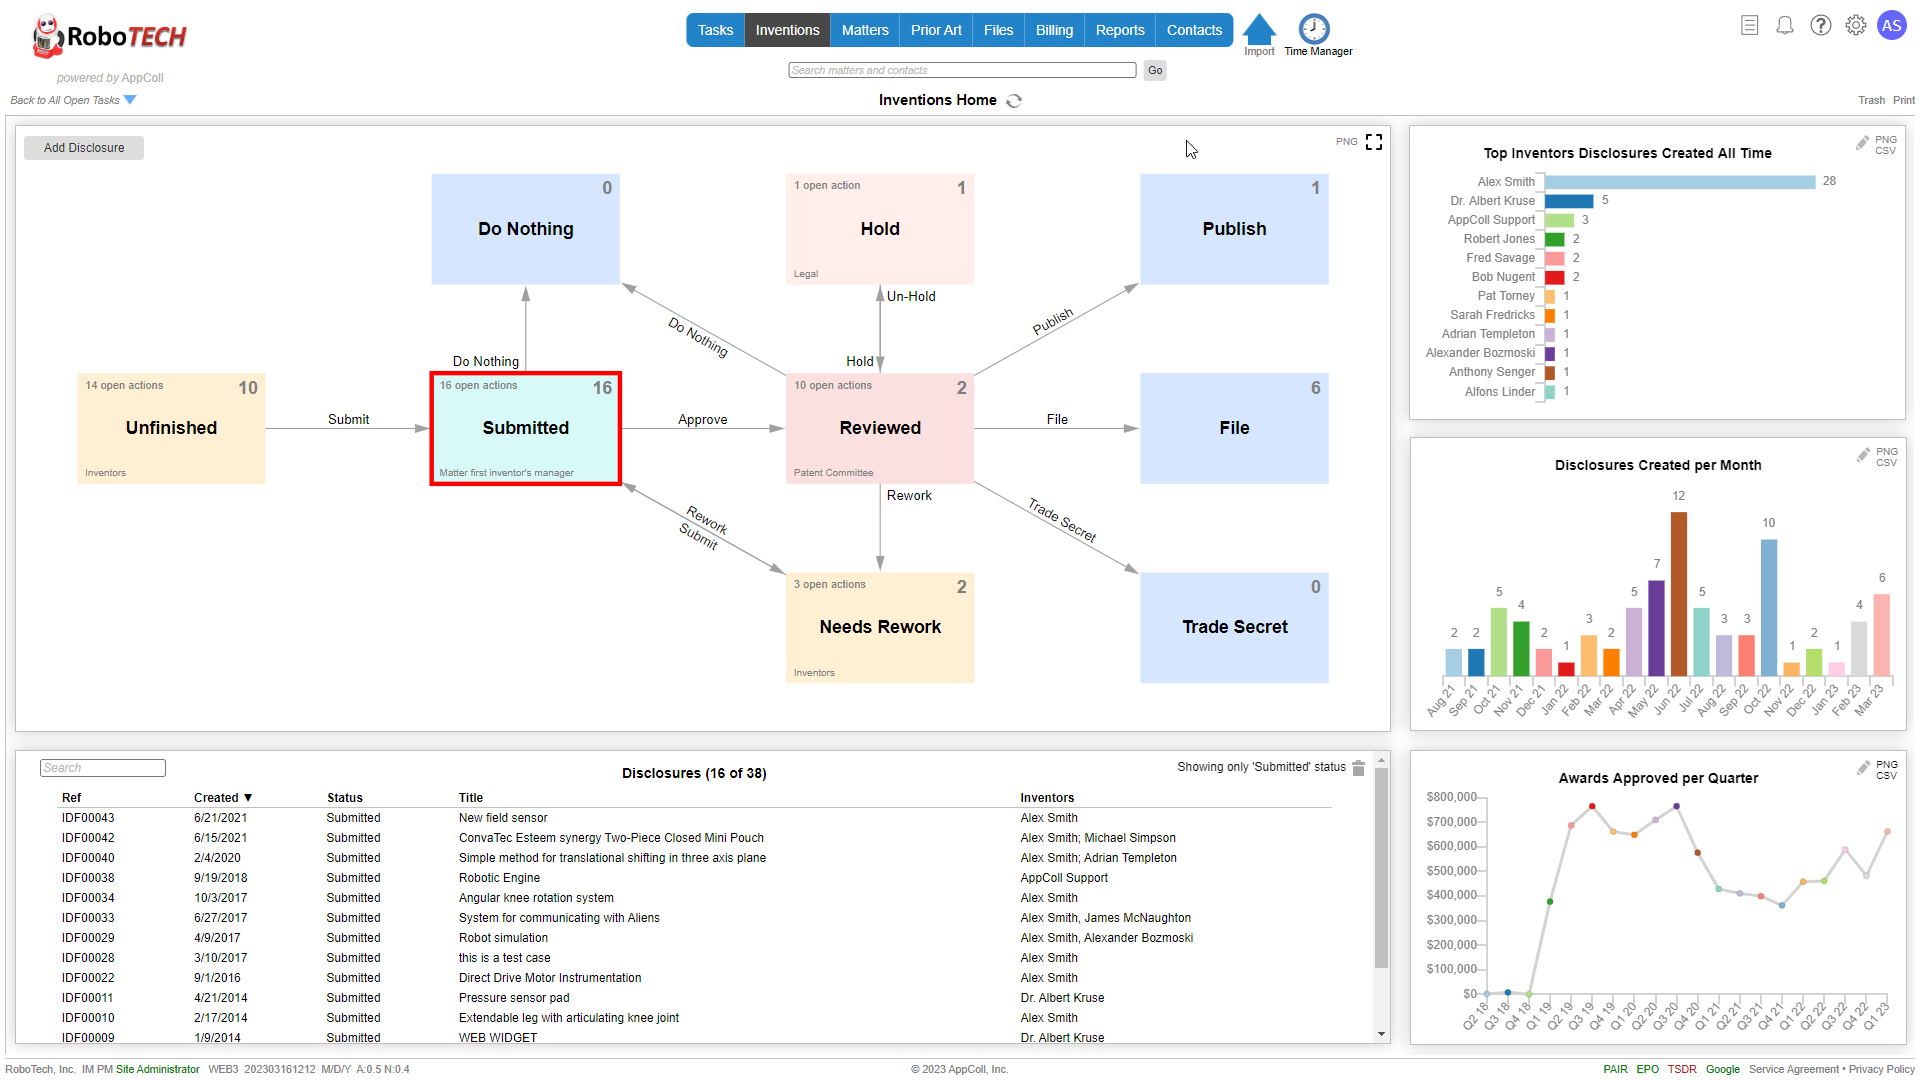
This page has 3 main sections: The inventions flow chart in the upper left, a list of disclosures or actions in the lower left, and a set of three customizable charts on the right. All information for the page is loaded once when you open the page. All changes to the charts will only show data when the page was loaded. If you wish to update the data, click on the reload icon next to the "Inventions Home" title.
The information shown on this page depends on who is logged in. If the user is a patent committee member or an account administrator then all features and information described below will be available. If the user is an inventor or manager then they will only be able to see information related to their own disclosures. They will also not be able to view the list of disclosures open actions. The list of available chart options is also greatly reduced for inventors and managers.
Inventions Flow Chart
In the flow chart, you see the annotated disclosure approval flow chart. Your specific flow chart may look different depending on your account configuration. You can zoom the flow chart by using the mouse scroll wheel or the page up and page down keys. You can move the chart by dragging with the mouse or by using the cursor keys. In the upper right of the flow chart, you can click on "PNG" to download a PNG image of the entire flow chart. You can click on the maximize icon to view the flow chart full screen.
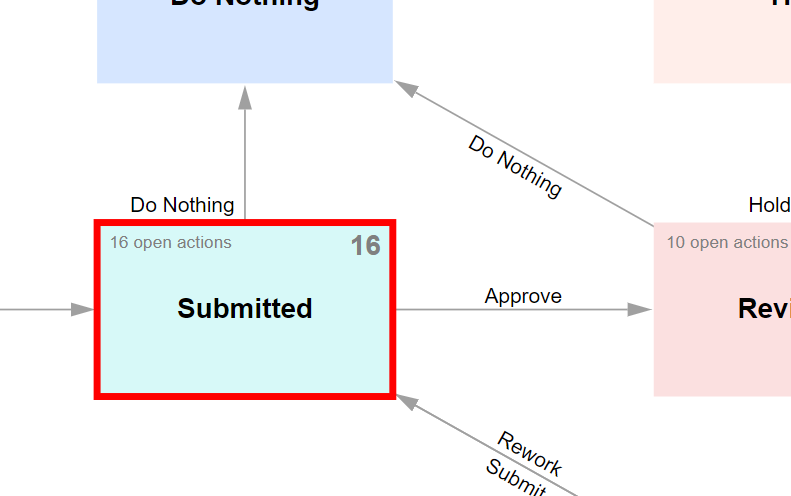
For each stage in the flow chart, there is an annotated status box. The top left of the box shows the number of open actions for disclosures with this status. Clicking on this text will show everyone with an open action for disclosures with this status in the list at the bottom. The number in the top right is the total number of disclosures with this status. Clicking on this number will show all disclosures with this status in the list at the bottom. If you click on a status box it will highlight in red to indicate that the list at the bottom is filtered for that status. Clicking anywhere else in the flow chart removes the status box selection to show either all disclosures or all open actions in the list below.
The arrows extending from the box indicate the next possible steps for the disclosures with this status.
Disclosure and Actions List
The list at the bottom of the page shows either disclosures or open actions depending on what has been selected in the flow chart. If the list is filtered to one status the text and a trash can will appear at the top right of the list. Clicking on the trash can clears the status filter. You can also do a text search on the list by typing in the text box in the upper left. You can sort the list by clicking on the column headings.
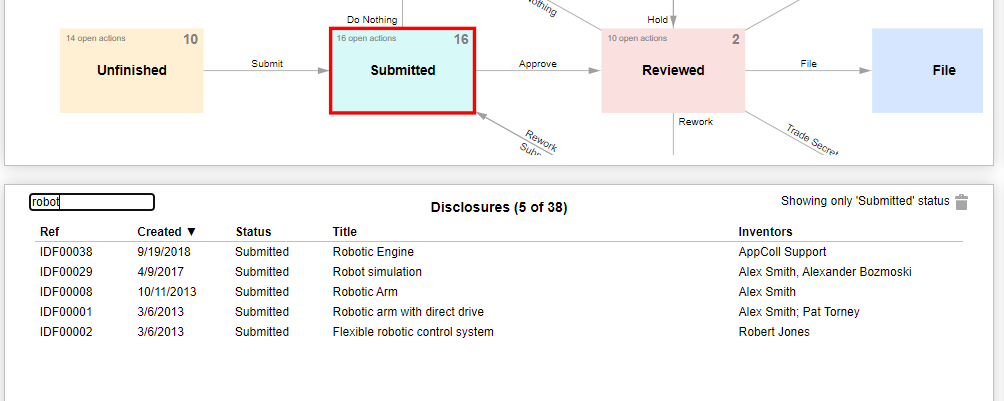
Clicking on a line in the list opens the disclosure or action for that line.
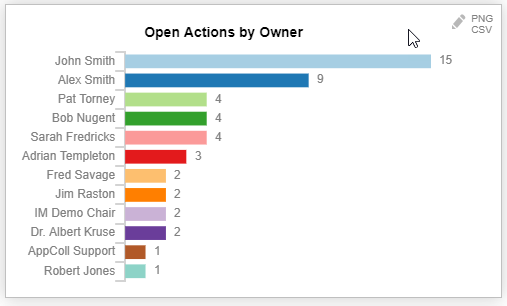
Charts
There are three chart tiles on the left to display various statistics about your inventions. You can configure these charts to display statistics in various formats for disclosures, awards, actions, matters and tasks. When you change a configuration, it is remembered until you change it again. You can download a CSV file of the information in the chart by clicking on "CSV" in the upper right.. You can download a PNG image of the chart by clicking on "PNG". Clicking on the chart segments or numbers opens a page with the data that generated that statistic.
To change the information shown in a chart tile, click on the pencil icon.
This shows the Edit Chart pop-up. From the Data drop-down select the information you wish to display. Then select the desired type icon and click on the Ok button. Note that some selections for Data only allow the information to be displayed in a table.
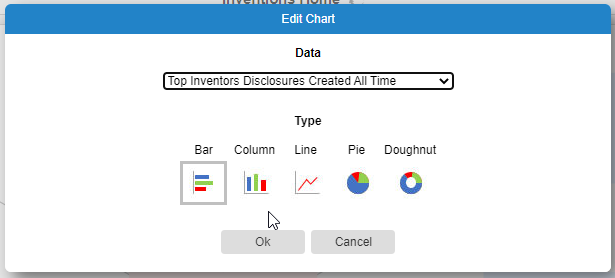
\